Objective
I've got a very specific needs: Selecting a firewalls to be installed between large number of monitoring servers and a big network (about one million of equipment).This mean lot's of short SNMP (UDP based) flows: I need a firewall able to manage 4 millions state table entries but don't need important throughput (few gigabit per second is enough).
Short look on the datasheet marked:
- Juniper SRX 3600: 6 millions concurrent sessions maximum and up to 65Gbps (marketing bullshit: Giving a value in Gbps is useless)
- Cisco ASA 5585-X: 4 millions concurrent sessions maximum and up to 15Gbps (same marketing bullshit unit as Juniper, marketing department seems stronger than engineering)
I will do my benches on a small Netgate RCC-VE 4860 (4 cores ATOM C2558, 8GB RAM) under FreeBSD 10.3: I'm rebooting it between each bench, and do a lot's of bench, then I need an equipment with a short POST BIOS time.
My performance unit will be the packet-per-second with smallest-size packet (64 bytes Ethernet frame size) generated at maximum line-rate (1.48Mpps if Gigabit interface, 14.8Mpps if 10 Gigabit interface).
Performance with default pf parameters
By default pf uses these maximum number of state values:[root@DUT]~# pfctl -sm
states hard limit 10000
src-nodes hard limit 10000
frags hard limit 5000
table-entries hard limit 200000
[root@DUT]~# sysctl net.pf
net.pf.source_nodes_hashsize: 8192
net.pf.states_hashsize: 32768
A very simple pf.conf will be used:
[root@DUT]~# cat /etc/pf.conf
set skip on lo0
pass
I will start by benching pf performance impact regarding number of states: between 128 to 9800.
For one unidirectional UDP flow pf will create 2 session entries (one for each direction).
As example, with a a packet generator like netmap's pkg-gen, we can ask for generating a range of 70 sources IP addresses and 70 destinations addresses: This will give total of 70*70=4900 unidirectional UDP flows (for 9800 pf states).
From theory to practice with pkt-gen:
pkt-gen -i ncxl0 -f tx -l 60 -d 198.19.10.1:2000-198.19.10.70 -D 00:07:43:2e:e5:90 -s 198.18.10.1:2000-198.18.10.70 -w 4
And during this load, we check number of current states:
[root@DUT]~# pfctl -si
Status: Enabled for 0 days 00:00:19 Debug: Urgent
State Table Total Rate
current entries 9800
searches 13777196 725115.6/s
inserts 9800 515.8/s
removals 0 0.0/s
Great: theory match practice, now I can start to generate multiple pktgen configuration (128, 512, 2048, 9800 states) on my bench script and run a first session:
olivier@manager:~/netbenches/Atom_C2558_4Cores-Intel_i350 % ~/netbenches/scripts/bench-lab.sh -f bench-lab-2nodes.config -n 10 -p ../pktgen.configs/FW-states-10k/ -d pf-sessions/results/fbsd10.3/
BSDRP automatized upgrade/configuration-sets/benchs script
This script will start 40 bench tests using:
- Multiples images to test: no
- Multiples configuration-sets to test: no
- Multiples pkt-gen configuration to test: yes
- Number of iteration for each set: 10
- Results dir: pf-sessions/results/fbsd10.3/
Do you want to continue ? (y/n): y
Testing ICMP connectivity to each devices:
192.168.1.3...OK
192.168.1.3...OK
192.168.1.9...OK
Testing SSH connectivity with key to each devices:
192.168.1.3...OK
192.168.1.3...OK
192.168.1.9...OK
Starting the benchs
Start configuration set: pf-statefull
Uploading cfg pf-session/config//pf-statefull
Rebooting DUT and waiting device return online...done
Start pkt-gen set: ../pktgen.configs/FW-states-10k//128
Start bench serie bench.pf-statefull.128.1
Waiting for end of bench 1/40...done
Rebooting DUT and waiting device return online...done
Start bench serie bench.pf-statefull.128.2
Waiting for end of bench 2/40...done
Rebooting DUT and waiting device return online...done
Start bench serie bench.pf-statefull.128.3
Waiting for end of bench 3/40...done
Rebooting DUT and waiting device return online...done
Start bench serie bench.pf-statefull.128.4
Waiting for end of bench 4/40...done
Rebooting DUT and waiting device return online...done
Start bench serie bench.pf-statefull.128.5
Waiting for end of bench 5/40...done
Rebooting DUT and waiting device return online...done
Start bench serie bench.pf-statefull.128.6
Waiting for end of bench 6/40...done
Rebooting DUT and waiting device return online...done
Start bench serie bench.pf-statefull.128.7
Waiting for end of bench 7/40...done
(etc.)
Waiting for end of bench 40/40...done
All bench tests were done, results in results/fbsd10.3/
Once done (3 hours after) we ask to generate a gnuplot.data file:
olivier@manager:% ~/netbenches/scripts/bench-lab-ministat.sh Atom_C2558_4Cores-Intel_i350/pf-session/results/fbsd10.3/
Ministating results...
Done
olivier@lame4: % cat Atom_C2558_4Cores-Intel_i350/pf-session/results/fbsd10.3/gnuplot.data
#index median minimum maximum
128 413891.5 409959 418019
512 411258 406566 413515
2048 392497.5 388039 401090
9800 372441.5 369681.5 377640
We obtains this result:

We notice a little performance impact when we reach the default 10K state table: From 413Kpps with 128 states in-used, it lower to 372Kpps.
Can we prevent this by tuning the pf.state_hashsize value ?
Can we prevent this by tuning the pf.state_hashsize value ?
Tuning pf.state_hashsize (for default 10K pf max states)
This value configure the table size used to store state hash and this value should be a power of 2.I didn't found how to check the efficient usage of this table, but I've found the relationship of this table size and the RAM consumed.
First test: On a system with unloaded pf.ko, configure a big states_hashsize:
echo 'net.pf.states_hashsize="8388608"' >> /boot/loader.conf
And start pf, then check the RAM reserved by pf_hash:
[root@DUT]~# service pf onestart
Enabling pf.
[root@DUT]~# vmstat -m | grep pf_hash
pf_hash 3 655680K - 3
We will try again with the next power-of-2 value: 16777216.
Theoretically, the RAM consumed with this value should be:
16777216 * 80 = 1342177280 (about 1,310,720KiB or 1.25GiB RAM).
From theory to practice, reboot the server and:
echo 'net.pf.states_hashsize="16777216"' >> /boot/loader.conf
[root@DUT]~# service pf onestart
Enabling pf.
[root@DUT]~# vmstat -m | grep pf_hash
pf_hash 3 1311040K - 3
But take care: On this 8GB RAM server, the maximum hashsize is 33,554,432 (2.5GB of RAM).
If configured to 67,108,864, this mean using 5GB of RAM on my 8GB server: this hang kldoal pf.ko (PR: 209475).
For the next bench, the number of flow will be fixed for generating 9800 pf state entries, but I will try different value of pf.states_hashsize until the maximum allowed on my 8GB RAM server (still with the default max states of 10k):

There is no need to increase pf.states_hashsize with 10k state entries, the default size is enough.
We just have to write down that with a 10K state table full, this equipment is still able to keept 372Kpps.
What about the performance drop if we increase a lot's more the pf state table ?
Increasing pf max states to 4 millions
Now increasing the number of max states by updating the simple pf configuration file allowing a maximum 4M states :
root@DUT:~ # cat /etc/pf.conf
set limit { states 4000000 }
set skip on lo0
pass
For filling 4M states, we just need to generate 2 millions of UDP flows in one direction, pf will create 2 entries in its table (one for each direction) using netmap pkt-gen:
( 5 * 256 + 134 ) source addresses * (5 * 256 + 134 ) destination addresses = 1,996,569 one-direction flows (about 4M pf state).
From theory to practice with pkt-gen:
pkt-gen -i ncxl0 -f tx -l 60 -d 198.19.10.0:2000-198.19.15.133 -D 00:07:43:2e:e5:90 -s 198.18.10.1:2000-198.18.15.133 -w 4
And current state entries:
[root@DUT]~# pfctl -si
Status: Enabled for 0 days 00:01:22 Debug: Urgent
State Table Total Rate
current entries 3998792
searches 7302196 89051.2/s
inserts 3998792 48765.8/s
removals 0 0.0/s
Does the relation ship between this 2 values linear ?
This mean because the increase factor was 400 between the default maximum number of state (10K) and this new value (4M), should the pf.states_hashsize need to be multiplied by 400 too ?
If the relationship between need to be linear, the best performance will be reacheable at 32768 * 400 = 13,107,200. But because we are using power of 2, this mean we need to reach between 8 or 16M pf.states_hashsize.
I didn't find answer in the man page neither in code comments, then I will restart the same previous bench regarding different value of pf.states_hashsize, until I reach the maximum value allowed on this 8GB RAM server.
#index median minimum maximum
32Ki 100809 99866 101388
65Ki 168147 165946 168726.5
128Ki 230205 222452 231987
256Ki 280163 278519 282029
512Ki 316142 313727 317546
1Mi 339614.5 336799 342808.5
2Mi 353461 349322 355908
4Mi 360044 357546 361448
8Mi 364828 361667 367729
16Mi 366323 363514 368747
32Mi 364977 363073 366800.5
And the graphic:
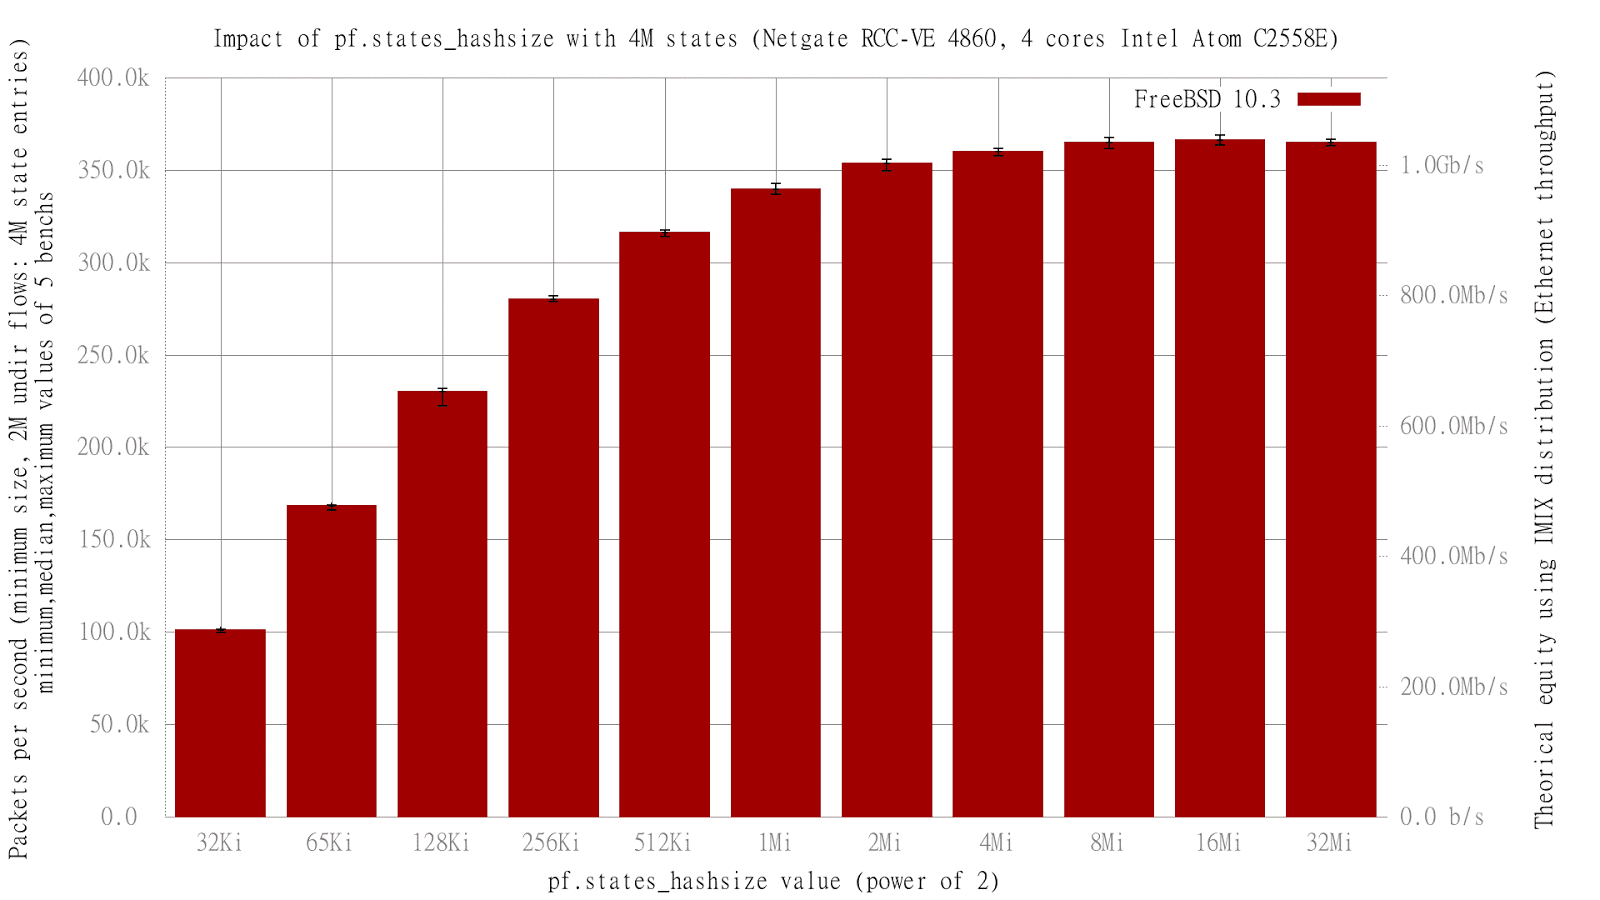
Theory seem confirmed: Best performance are when pf.states_hashsize reach 16M.
And notice that with 4M pf states in place of 10K, and correctly tuning pf.states_hashsize, there is no big performance drop:
There is only 12% performance penalty between pf 128 pf states and 4 million pf states.
Pushing the limit to maximum: 10 millions sates on a 8GB RAM server
My 8GB RAM system can be configured for 32M of pf.states_hashsize, wich is about 1024 bigger than the default pf.states_hashsize.Then, can I configure pf for managing 1024 more state than default , this mean (10,000 * 1024) = 10M state entries ?
Let's try!
[root@DUT]~# cat /etc/pf.conf
set limit { states 10000000 }
set skip on lo0
pass
[root@DUT]~# cat /boot/loader.conf
net.pf.states_hashsize="33554432"
A rapid check after the reboot:
[root@DUT]~# pfctl -sm
states hard limit 10000000
src-nodes hard limit 10000
frags hard limit 5000
table-entries hard limit 200000
[root@DUT]~# sysctl net.pf.states_hashsize
net.pf.states_hashsize: 33554432
And now a pkt-gen generating 5M unidirectional UDP flows:
[root@pkt]~# pkt-gen -U -f tx -i igb2 -l 60 -w 4 -d 198.19.10.0:2001-198.19.18.187 -D 00:08:a2:09:33:da -s 198.18.10.0:2001-198.18.18.187
And check number of pf states:
[root@netgate]~# pfctl -si
Status: Enabled for 0 days 00:03:52 Debug: Urgent
State Table Total Rate
current entries 9999392
searches 136730570 589355.9/s
inserts 9999392 43100.8/s
removals 0 0.0/s
Re-using the bench script for another number-of-states/performance graph, but pushing the maximum limit to 10M:
% cat gnuplot.data
#index median minimum maximum
128 406365 371415 411379
1K 368245.5 367299 370606
1M 367210 365505 370600
2M 367252 365939 369866
4M 365722 362921.5 369635.5
6M 365899 365213 368887
10M 362200 351420 365515

With 10M state, pf performance lower to 362Kpps: Still only 12% lower performance than with only 128 states.
pfsync impact
After testing the behavior with only one firewalll, how about the behavior of pfsync with 10M states table to synchronize with another firewall ?
During previous benches, the traffic was sent at gigabit line-rate traffic (1.48Mpps) and this heavy load prevent to entering command to this small firewall console. How will it share resources with pfsync ?
Configuring pfsync (same on another "backup" firewall) on a unused interface (using syncpeer because I don't want to send my switch in the sky with potentially large number of multicast):
sysrc pfsync_enable="YES"
sysrc pfsync_syncdev="igb5"
sysrc pfsync_syncpeer="192.168.1.8"
And we try by generating unidirectionnal 5million UDP flows a line-rate:
[root@pkt]~#pkt-gen -U -f tx -i igb2 -n 300000000 -l 60 -d 198.19.10.0:2001-198.19.18.187 -D 00:08:a2:09:33:da -s 198.18.10.0:2001-198.18.18.187 -w 4
But no pfsync traffic received on backup firewall, the DUT didn't have enough resources (all are spend to drop lot's of received 1.48Mpps rate) for managing correctly pfsync.
We need to lower packet rate to 200Kpps:
[root@pkt]~#pkt-gen -U -f tx -i igb2 -n 300000000 -l 60 -d 198.19.10.0:2001-198.19.18.187 -D 00:08:a2:09:33:da -s 198.18.10.0:2001-198.18.18.187 -w 4 -R 20000
At this lower rate, the DUT have enough resource for updating pfsync, the backup firewall start to receive see some states:
[root@backup]~# pfctl -si
Status: Enabled for 0 days 00:25:23 Debug: Urgent
State Table Total Rate
current entries 1007751
searches 99696386 65460.5/s
inserts 25494221 16739.5/s
removals 24486050 16077.5/s
And pfsync traffic can reach 100Mb/s:
/0 /1 /2 /3 /4 /5 /6 /7 /8 /9 /10
Load Average |
Interface Traffic Peak Total
pfsync0 in 12.763 MB/s 105.422 MB/s 11.073 GB
out 371.891 KB/s 7.476 MB/s 876.564 MB
igb0 in 12.896 MB/s 106.495 MB/s 11.184 GB
out 375.360 KB/s 7.546 MB/s 885.000 MB
Conclusion
- There need to be a linear relationship between the pf hard-limit of states and the pf.states_hashsize;
- RAM needed for pf.states_hashsize = pf.states_hashsize * 80 Byte and pf.states_hashsize should be a power of 2 (from the manual page);
- Even small hardware can manage large number of sessions (it's a matter of RAM), but under too lot's of pressure pfsync will suffer.


