samedi, mai 14, 2016

Playing with FreeBSD packet filter state table limits

Objective

I've got a very specific needs: Selecting a firewalls to be installed between large number of monitoring servers and a big network (about one million of equipment).
This mean lot's of short SNMP (UDP based) flows: I need a firewall able to manage 4 millions state table entries but don't need important throughput (few gigabit per second is enough).
Short look on the datasheet marked:
  • Juniper SRX 3600: 6 millions concurrent sessions maximum and up to 65Gbps (marketing bullshit: Giving a value in Gbps is useless)
  • Cisco ASA 5585-X: 4 millions concurrent sessions maximum and up to 15Gbps (same marketing bullshit unit as Juniper, marketing department seems stronger than engineering)
I'm not looking for such big throughput, then how about performance vs maximum number of firewall states on a simple x86 servers ?

I will do my benches on a small Netgate RCC-VE 4860 (4 cores ATOM C2558, 8GB RAM) under FreeBSD 10.3: I'm rebooting it between each bench, and do a lot's of bench, then I need an equipment with a short POST BIOS time.
My performance unit will be the packet-per-second with smallest-size packet (64 bytes Ethernet frame size) generated at maximum line-rate (1.48Mpps if Gigabit interface, 14.8Mpps if 10 Gigabit interface).

Performance with default pf parameters

By default pf uses these maximum number of state values:
[root@DUT]~# pfctl -sm
states        hard limit    10000
src-nodes     hard limit    10000
frags         hard limit     5000
table-entries hard limit   200000
[root@DUT]~# sysctl net.pf
net.pf.source_nodes_hashsize: 8192
net.pf.states_hashsize: 32768

This mean it manages 10K session maximum with a size of pf states hashsize of 32768 (no idea of the unit).

A very simple pf.conf will be used:
[root@DUT]~# cat /etc/pf.conf
set skip on lo0
pass

I will start by benching  pf performance impact regarding number of states: between 128 to 9800.
For one unidirectional UDP flow pf will create 2 session entries (one for each direction).
As example, with a a packet generator like netmap's pkg-gen, we can ask for generating a range of 70 sources IP addresses and 70 destinations addresses: This will give total of 70*70=4900 unidirectional UDP flows (for 9800 pf states).

From theory to practice with pkt-gen:
pkt-gen -i ncxl0 -f tx -l 60 -d 198.19.10.1:2000-198.19.10.70 -D 00:07:43:2e:e5:90 -s 198.18.10.1:2000-198.18.10.70 -w 4

And during this load, we check number of current states:

[root@DUT]~# pfctl -si
Status: Enabled for 0 days 00:00:19           Debug: Urgent

State Table                          Total             Rate
  current entries                     9800
  searches                        13777196       725115.6/s
  inserts                             9800          515.8/s
  removals                               0            0.0/s

Great: theory match practice, now I can start to generate multiple pktgen configuration (128, 512, 2048, 9800 states) on my bench script and run a first session:

olivier@manager:~/netbenches/Atom_C2558_4Cores-Intel_i350 % ~/netbenches/scripts/bench-lab.sh -f bench-lab-2nodes.config -n 10 -p ../pktgen.configs/FW-states-10k/ -d pf-sessions/results/fbsd10.3/
BSDRP automatized upgrade/configuration-sets/benchs script

This script will start 40 bench tests using:
 - Multiples images to test: no
 - Multiples configuration-sets to test: no
 - Multiples pkt-gen configuration to test: yes
 - Number of iteration for each set: 10
 - Results dir: pf-sessions/results/fbsd10.3/

Do you want to continue ? (y/n): y
Testing ICMP connectivity to each devices:
  192.168.1.3...OK
  192.168.1.3...OK
  192.168.1.9...OK
Testing SSH connectivity with key to each devices:
  192.168.1.3...OK
  192.168.1.3...OK
  192.168.1.9...OK
Starting the benchs
Start configuration set: pf-statefull
Uploading cfg pf-session/config//pf-statefull
Rebooting DUT and waiting device return online...done
Start pkt-gen set: ../pktgen.configs/FW-states-10k//128
Start bench serie bench.pf-statefull.128.1
Waiting for end of bench 1/40...done
Rebooting DUT and waiting device return online...done
Start bench serie bench.pf-statefull.128.2
Waiting for end of bench 2/40...done
Rebooting DUT and waiting device return online...done
Start bench serie bench.pf-statefull.128.3
Waiting for end of bench 3/40...done
Rebooting DUT and waiting device return online...done
Start bench serie bench.pf-statefull.128.4
Waiting for end of bench 4/40...done
Rebooting DUT and waiting device return online...done
Start bench serie bench.pf-statefull.128.5
Waiting for end of bench 5/40...done
Rebooting DUT and waiting device return online...done
Start bench serie bench.pf-statefull.128.6
Waiting for end of bench 6/40...done
Rebooting DUT and waiting device return online...done
Start bench serie bench.pf-statefull.128.7
Waiting for end of bench 7/40...done
(etc.)
Waiting for end of bench 40/40...done
All bench tests were done, results in results/fbsd10.3/

Once done (3 hours after) we ask to generate a gnuplot.data file:

olivier@manager:% ~/netbenches/scripts/bench-lab-ministat.sh  Atom_C2558_4Cores-Intel_i350/pf-session/results/fbsd10.3/
Ministating results...
Done
olivier@lame4: % cat Atom_C2558_4Cores-Intel_i350/pf-session/results/fbsd10.3/gnuplot.data
#index median minimum maximum
128 413891.5 409959 418019
512 411258 406566 413515
2048 392497.5 388039 401090
9800 372441.5 369681.5 377640

We obtains this result:


We notice a little performance impact when we reach the default 10K state table: From 413Kpps with 128 states in-used, it lower to 372Kpps.
Can we prevent this by tuning the pf.state_hashsize value ?

Tuning pf.state_hashsize (for default 10K pf max states)

This value configure the table size used to store state hash and this value should be a power of 2.
I didn't found how to check the efficient usage of this table, but I've found the relationship of this table size and the RAM consumed.
First test: On a system with unloaded pf.ko, configure a big states_hashsize:
echo 'net.pf.states_hashsize="8388608"' >> /boot/loader.conf

And start pf, then check the RAM reserved by pf_hash:
[root@DUT]~# service pf onestart

Enabling pf.
[root@DUT]~# vmstat -m | grep pf_hash
      pf_hash     3 655680K       -        3

pf_hash consume 655680KiB of RAM: It's about 80 times the state_hashsize.

We will try again with the next power-of-2 value: 16777216.
Theoretically, the RAM consumed with this value should be:
16777216 * 80 = 1342177280 (about 1,310,720KiB or 1.25GiB RAM).

From theory to practice, reboot the server and:
echo 'net.pf.states_hashsize="16777216"' >> /boot/loader.conf

[root@DUT]~# service pf onestart

Enabling pf.
[root@DUT]~# vmstat -m | grep pf_hash

      pf_hash     3 1311040K       -        3

Great: We've got the relationship between pf.states_hashsize and RAM consumed.
But take care: On this 8GB RAM server, the maximum hashsize is 33,554,432 (2.5GB of RAM).
If configured to 67,108,864, this mean using 5GB of RAM on my 8GB server: this hang kldoal pf.ko (PR: 209475).

For the next bench, the number of flow will be fixed for generating 9800 pf state entries, but I will try different value of pf.states_hashsize until the maximum allowed on my 8GB RAM server (still with the default max states of 10k):

There is no need to increase pf.states_hashsize with 10k state entries, the default size is enough.
We just have to write down that with a 10K state table full, this equipment is still able to keept 372Kpps.
What about the performance drop if we increase a lot's more the pf state table ?

Increasing pf max states to 4 millions

Now increasing the number of max states by updating the simple pf configuration file allowing a maximum 4M states :

root@DUT:~ # cat /etc/pf.conf
set limit { states 4000000 }
set skip on lo0
pass

For filling 4M states, we just need to generate 2 millions of UDP flows in one direction, pf will create 2 entries in its table (one for each direction) using netmap pkt-gen:

( 5 * 256 + 134 ) source addresses * (5 * 256 + 134 ) destination addresses = 1,996,569 one-direction flows (about 4M pf state).

From theory to practice with pkt-gen:
pkt-gen -i ncxl0 -f tx -l 60 -d 198.19.10.0:2000-198.19.15.133 -D 00:07:43:2e:e5:90 -s 198.18.10.1:2000-198.18.15.133 -w 4

And current state entries:
[root@DUT]~# pfctl -si
Status: Enabled for 0 days 00:01:22           Debug: Urgent

State Table                          Total             Rate
  current entries                  3998792
  searches                         7302196        89051.2/s
  inserts                          3998792        48765.8/s
  removals                               0            0.0/s


It should be logic to increase pf.states_hashsize too after increasing the maximum states: But what value to be set ?
Does the relation ship between this 2 values linear ?
This mean because the increase factor was 400 between the default maximum number of state (10K) and this new value (4M), should the pf.states_hashsize need to be multiplied by 400 too ?

If the relationship between need to be linear, the best performance will be reacheable at 32768 * 400 = 13,107,200. But because we are using power of 2, this mean we need to reach between 8 or 16M pf.states_hashsize.

I didn't find answer in the man page neither in code comments, then I will restart the same previous bench regarding different value of pf.states_hashsize, until I reach the maximum value allowed on this 8GB RAM server.

#index median minimum maximum
32Ki 100809 99866 101388
65Ki 168147 165946 168726.5
128Ki 230205 222452 231987
256Ki 280163 278519 282029
512Ki 316142 313727 317546
1Mi 339614.5 336799 342808.5
2Mi 353461 349322 355908
4Mi 360044 357546 361448
8Mi 364828 361667 367729
16Mi 366323 363514 368747
32Mi 364977 363073 366800.5

And the graphic:


Theory seem confirmed: Best performance are when pf.states_hashsize reach 16M.

And notice that with 4M pf states in place of 10K, and correctly tuning pf.states_hashsize, there is no big performance drop:
There is only 12% performance penalty between pf 128 pf states and 4 million pf states.

Pushing the limit to maximum: 10 millions sates on a 8GB RAM server

My 8GB RAM system can be configured for 32M of pf.states_hashsize, wich is about 1024 bigger than the default pf.states_hashsize.
Then, can I configure pf for managing 1024 more state than default , this mean (10,000 * 1024) = 10M state entries ?

Let's try!

[root@DUT]~# cat /etc/pf.conf
set limit { states 10000000 }
set skip on lo0
pass

[root@DUT]~# cat /boot/loader.conf
net.pf.states_hashsize="33554432"

A rapid check after the reboot:

[root@DUT]~# pfctl -sm
states        hard limit 10000000
src-nodes     hard limit    10000
frags         hard limit     5000

table-entries hard limit   200000
[root@DUT]~# sysctl net.pf.states_hashsize

net.pf.states_hashsize: 33554432

And now a pkt-gen generating 5M unidirectional UDP flows:

[root@pkt]~# pkt-gen -U -f tx -i igb2 -l 60 -w 4 -d 198.19.10.0:2001-198.19.18.187 -D 00:08:a2:09:33:da -s 198.18.10.0:2001-198.18.18.187

And check number of pf states:

[root@netgate]~# pfctl -si
Status: Enabled for 0 days 00:03:52           Debug: Urgent

State Table                          Total             Rate
  current entries                  9999392
  searches                       136730570       589355.9/s
  inserts                          9999392        43100.8/s
  removals                               0            0.0/s

Re-using the bench script for another number-of-states/performance graph, but pushing the maximum limit to 10M:

% cat gnuplot.data
#index median minimum maximum
128 406365 371415 411379
1K 368245.5 367299 370606
1M 367210 365505 370600
2M 367252 365939 369866
4M 365722 362921.5 369635.5
6M 365899 365213 368887
10M 362200 351420 365515


With 10M state, pf performance lower to 362Kpps: Still only 12% lower performance than with only 128 states.

pfsync impact

After testing the behavior with only one firewalll, how about the behavior of pfsync with 10M states table to synchronize with another firewall ?
During previous benches, the traffic was sent at gigabit line-rate traffic (1.48Mpps) and this heavy load prevent to entering command to this small firewall console. How will it share resources with pfsync ?
Configuring pfsync (same on another "backup" firewall) on a unused interface (using syncpeer because I don't want to send my switch in the sky with potentially large number of multicast):

sysrc pfsync_enable="YES"
sysrc pfsync_syncdev="igb5"
sysrc pfsync_syncpeer="192.168.1.8"

And we try by generating unidirectionnal 5million UDP flows a line-rate:

[root@pkt]~#pkt-gen -U -f tx -i igb2 -n 300000000 -l 60 -d 198.19.10.0:2001-198.19.18.187 -D 00:08:a2:09:33:da -s 198.18.10.0:2001-198.18.18.187 -w 4

But no pfsync traffic received on backup firewall, the DUT didn't have enough resources (all are spend to drop lot's of received 1.48Mpps rate) for managing correctly pfsync.

We need to lower packet rate to 200Kpps:

[root@pkt]~#pkt-gen -U -f tx -i igb2 -n 300000000 -l 60 -d 198.19.10.0:2001-198.19.18.187 -D 00:08:a2:09:33:da -s 198.18.10.0:2001-198.18.18.187 -w 4 -R 20000

At this lower rate, the DUT have enough resource for updating pfsync, the backup firewall start to receive see some states:

[root@backup]~# pfctl -si
Status: Enabled for 0 days 00:25:23           Debug: Urgent

State Table                          Total             Rate
  current entries                  1007751
  searches                        99696386        65460.5/s
  inserts                         25494221        16739.5/s
  removals                        24486050        16077.5/s

And pfsync traffic can reach 100Mb/s:

              /0   /1   /2   /3   /4   /5   /6   /7   /8   /9   /10
Load Average   |

Interface           Traffic               Peak                Total
  pfsync0  in     12.763 MB/s        105.422 MB/s           11.073 GB
           out   371.891 KB/s          7.476 MB/s          876.564 MB

     igb0  in     12.896 MB/s        106.495 MB/s           11.184 GB
           out   375.360 KB/s          7.546 MB/s          885.000 MB


Conclusion


  • There need to be a linear relationship between the pf hard-limit of states and the pf.states_hashsize;
  • RAM needed for pf.states_hashsize = pf.states_hashsize * 80 Byte and pf.states_hashsize should be a power of 2 (from the manual page);
  • Even small hardware can manage large number of sessions (it's a matter of RAM),  but under too lot's of pressure pfsync will suffer.

vendredi, janvier 15, 2016

Example of a FreeBSD bug hunting session by a simple user


Problem description


I've meet a problem with one of my FreeBSD-wireless-router, and a FreeBSD network developer (Alexander V. Chernikov, alias melifaro) helps me to identify the culprit kernel function. I've write-down all tips I've learn by this teacher during this session here.

Day 1: Facing a bug


You need a bug for starting your day. In my case, after updating the configuration of previously working wireless-router, my setup stop working correctly.

Day 2: Reducing my setup complexity


My wireless-router configuration was complex: it involves routing, wireless in hostap mode, ipfw, snort, bridge, openvpn, etc.
The first step was to reproduce my problem:

  1. In the minimum steps (this mean with the simplest configuration)
  2. On the latest FreeBSD -current (because developers works on -current)

Rules for getting help: Your call-for-help message needs to be short, because developers don't have lot's of free time. It's very important that you clearly demonstrate a non-attended behavior and the steps for reproduce it easily.
I had to to it twice: I've post a first call-for-help message with a still too complex configuration:
https://lists.freebsd.org/pipermail/freebsd-current/2015-December/059045.html

Then I had to work again for simplify my problem and post a new message few days later:
https://lists.freebsd.org/pipermail/freebsd-current/2016-January/059250.html

This second message was a good one: It catch some developer eyes :-)

A resume of my bug with this setup:

LAN 0 <--> (re0) fbsd router (bridge0 = re1 + wlan0) <--> LAN 1 and Wireless LAN

This FreeBSD (11-head r293631) is configured like that:

  • One IP address on re0, we will call this LAN 0
  • One IP address on bridge0 (that includes interfaces re1 and wlan0)
  • re1 enabled (put in UP state)
  • wlan0 configured in hostap mode
  • forwarding enabled

But this setup can forward between wireless clients and hosts on LAN 0 ONLY if interface re1 (that belong to bridge0) is in "connected" status !?!
If the Ethernet NIC is in "not connected" status, the FreeBSD router will consider all clients behind bridge0 "unreacheable"… Even if it can ping all wireless clients!
Here is a tcpdump output from the router dumping a ping generated by a wireless clients (1.1.1.2, connected to wlan0 and forwarded by cbridge0) toward an host on LAN 0 (1.0.0.2):

root@fbsd-router:~ # tcpdump -pni re0
tcpdump: verbose output suppressed, use -v or -vv for full protocol decode
listening on re0, link-type EN10MB (Ethernet), capture size 262144 bytes
23:38:04.466866 ARP, Request who-has 1.0.0.2 tell 1.0.0.1, length 28
23:38:04.467052 ARP, Reply 1.0.0.2 is-at 00:08:a2:09:c4:a2, length 46
23:38:04.467090 IP 1.1.1.2 > 1.0.0.2: ICMP echo request, id 72, seq 1,length 64
23:38:04.467226 IP 1.0.0.2 > 1.1.1.2: ICMP echo reply, id 72, seq 1, length 64
23:38:04.467300 IP 1.0.0.1 > 1.0.0.2: ICMP host 1.1.1.2 unreachable, length 36
23:38:05.483053 IP 1.1.1.2 > 1.0.0.2: ICMP echo request, id 72, seq 2,length 64
23:38:05.483259 IP 1.0.0.2 > 1.1.1.2: ICMP echo reply, id 72, seq 2, length 64
23:38:05.483318 IP 1.0.0.1 > 1.0.0.2: ICMP host 1.1.1.2 unreachable, length 36
23:38:06.387304 IP 1.1.1.2 > 1.0.0.2: ICMP echo request, id 72, seq 3,length 64
23:38:06.387466 IP 1.0.0.2 > 1.1.1.2: ICMP echo reply, id 72, seq 3, length 64
23:38:06.387514 IP 1.0.0.1 > 1.0.0.2: ICMP host 1.1.1.2 unreachable, length 36
^C
For solving this problem, I just need to plug the Ethernet interface for changing its status to "active".


Checking interface status: a simple user's way


The only check I can do was to check the "status" of my interfaces:

root@fbsd-router# ifconfig re0
re0: flags=8843<UP,BROADCAST,RUNNING,SIMPLEX,MULTICAST> metric 0 mtu 1500
        options=8209b<RXCSUM,TXCSUM,VLAN_MTU,VLAN_HWTAGGING,VLAN_HWCSUM,WOL_MAGIC,LINKSTATE>
        ether 00:0d:b9:3c:ae:24
        inet 1.0.0.1 netmask 0xffffff00 broadcast 1.0.0.255
        nd6 options=29<PERFORMNUD,IFDISABLED,AUTO_LINKLOCAL>
        media: Ethernet autoselect (1000baseT <full-duplex,master>)
        status: active

root@fbsd-router# ifconfig wlan0
wlan0: flags=8943<UP,BROADCAST,RUNNING,PROMISC,SIMPLEX,MULTICAST> metric 0 mtu 1500
        ether 04:f0:21:17:3b:d7
        nd6 options=29<PERFORMNUD,IFDISABLED,AUTO_LINKLOCAL>
        media: IEEE 802.11 Wireless Ethernet autoselect mode 11ng <hostap>
        status: running
        ssid tutu channel 6 (2437 MHz 11g ht/40+) bssid 04:f0:21:17:3b:d7
        country US ecm authmode OPEN privacy OFF txpower 27 scanvalid 60
        protmode CTS ampdulimit 64k ampdudensity 8 shortgi wme burst
        dtimperiod 1 -dfs
        groups: wlan

root@fbsd-router# ifconfig re1
re1: flags=8943<UP,BROADCAST,RUNNING,PROMISC,SIMPLEX,MULTICAST> metric 0 mtu 1500
        options=82099<RXCSUM,VLAN_MTU,VLAN_HWTAGGING,VLAN_HWCSUM,WOL_MAGIC,LINKSTATE>
        ether 00:0d:b9:3c:ae:25
        nd6 options=29<PERFORMNUD,IFDISABLED,AUTO_LINKLOCAL>
        media: Ethernet autoselect (none)
        status: no carrier

root@fbsd-router# ifconfig bridge0
bridge0: flags=8843<UP,BROADCAST,RUNNING,SIMPLEX,MULTICAST> metric 0 mtu 1500
        ether 02:6b:c0:de:b8:00
        inet 1.1.1.1 netmask 0xffffff00 broadcast 1.1.1.255
        nd6 options=9<PERFORMNUD,IFDISABLED>
        groups: bridge
        id 00:00:00:00:00:00 priority 32768 hellotime 2 fwddelay 15
        maxage 20 holdcnt 6 proto rstp maxaddr 2000 timeout 1200
        root id 00:00:00:00:00:00 priority 32768 ifcost 0 port 0
        member: re1 flags=143<LEARNING,DISCOVER,AUTOEDGE,AUTOPTP>
                ifmaxaddr 0 port 2 priority 128 path cost 55
        member: wlan0 flags=143<LEARNING,DISCOVER,AUTOEDGE,AUTOPTP>
                ifmaxaddr 0 port 5 priority 128 path cost 33333

Nothing seems wrong here:

  • re0 has flag UP and status "active"
  • wlan0 has flag UP and status "running" (I will suppose it's okay because wireless clients paquets correctly enter this interface and even ping bridge0 IP address)
  • re1 has flag UP and status "no carrier" (no cable connected)
  • bridge0 has flag UP but did not display its status (I will suppose it's UP because wireless client can ping it)


But a developer will never "suppose" the status of these interfaces and will speak in their strange language directly to the kernel for asking the real status.


Checking kernel interface status: a developer's way


How FreeBSD kernel manage network interface ? As a simple user, let's read the (huge) "man ifconfig". I didn't found my answer, but the "see also" section mention a "man netintro".
An introduction to "network" should be comprehensive for me.
Inside netintro man page, I've skipped addressing and routing sections for the interfaces section, but nothing here about "interface status". But the "see also" section mention a "man ifnet": Let's try!
Trying to resume this man page:

(...)
     The kernel mechanisms for handling network interfaces reside primarily in
     the ifnet, if_data, ifaddr, and ifmultiaddr structures in <net/if.h> and
     <net/if_var.h> and the functions named above and defined in
     /sys/net/if.c.
(...)
The system keeps a linked list of interfaces using the TAILQ macros
     defined in queue(3); this list is headed by a struct ifnethead called
     ifnet. The elements of this list are of type struct ifnet...
(...)
     The structure additionally contains generic statistics applicable to a
     variety of different interface types (except as noted, all members are of
     type u_long):

           ifi_link_state      (u_char) The current link state of Ethernet
                               interfaces.  See the Interface Link States
                               section for possible values.
(...)
 Interface Link States
     The following link states are currently defined:

           LINK_STATE_UNKNOWN      The link is in an invalid or unknown state.
           LINK_STATE_DOWN         The link is down.
           LINK_STATE_UP           The link is up.


Wow, I reach my limits ;-) But here is my understanding:

  1. Each network interface have an index number assigned
  2. once known this index number we can read its state by variable ifi_link_state


I've got 3 new questions now :-(

How to know the "index" number of my interfaces ?


User used to uses "netstat -i" should know the "Link#" displayed:

root@fbsd-router:~ # netstat -iWW | grep Link# | tr -s ' ' | cut -d ' ' -f 1-3
re0 1500 <Link#1>
re1 1500 <Link#2>
re2* 1500 <Link#3>
lo0 16384 <Link#4>
wlan0 1500 <Link#5>
bridge0 1500 <Link#6>

This link number is the interface index number :-)

How to display this variable (ifi_link_state) ?


This answer came from melifaro@ : "use kernel debugger (kgdb) for printing value of variable called ifindex_table[INDEX].if_link_state".

How did this wizzard of code find variable ifindex_table[] ?

I had to use "grep ifindex_table /usr/src/sys/net/*" and found that ifindex_table is defined in if.c as "Table of ifnet by index."
Reading the source code is mandatory here for discovering this variable name.

Why variable is if_link_state and not ifi_link_state like written in ifnet(9) ?

It seems that ifnet(9) (the manual page) is not up-to-date.

Time to play with live kernel debugging


root@fbsd-router:~ # kgdb /boot/kernel/kernel /dev/mem
GNU gdb 6.1.1 [FreeBSD]
Copyright 2004 Free Software Foundation, Inc.
(...)

(kgdb) print ifindex_table[1].if_link_state
$1 = 2 '\002'
(kgdb) p ifindex_table[2].if_link_state
$2 = 1 '\001'
(kgdb) p ifindex_table[5].if_link_state
$3 = 0 '\0'
(kgdb) p ifindex_table[6].if_link_state
$4 = 1 '\001'

Great: I've got some values!
We can even print the full structure with command "ptype":
(kgdb) ptype ifindex_table[1]
type = struct ifnet {
    struct {
        struct ifnet *tqe_next;
        struct ifnet **tqe_prev;
    } if_link;
    struct {
        struct ifnet *le_next;
        struct ifnet **le_prev;
    } if_clones;
    struct {
        struct ifg_list *tqh_first;
        struct ifg_list **tqh_last;
    } if_groups;
    u_char if_alloctype;
    void *if_softc;
    void *if_llsoftc;
    void *if_l2com;
    const char *if_dname;
    int if_dunit;
    u_short if_index;
    short if_index_reserved;
    char if_xname[0];
    char *if_description;
    int if_flags;
    int if_drv_flags;
    int if_capabilities;
    int if_capenable;
    void *if_linkmib;
    size_t if_linkmiblen;
    u_int if_refcount;
    uint8_t if_type;
    uint8_t if_addrlen;
    uint8_t if_hdrlen;
    uint8_t if_link_state;
    uint32_t if_mtu;
    uint32_t if_metric;
    uint64_t if_baudrate;
    uint64_t if_hwassist;
(...)
Funny but useless for my current task.

How to convert link_state values in Human language ?


Another "grep LINK_STATE /usr/src/sys/net/*" for the answer: they are described in if.h:

/*
 * Values for if_link_state.
 */
#define LINK_STATE_UNKNOWN      0       /* link invalid/unknown */
#define LINK_STATE_DOWN         1       /* link is down */
#define LINK_STATE_UP           2       /* link is up */


Now I can translate the "kernel view" of my interfaces:

  • re0 (index 1) is in state 2 (UP)
  • re1 (index 2) is in state 1 (DOWN)
  • wlan0 (index 5) is in state 0 (UNKNOWN)
  • bridge0 (index 6) is in state 1 (DOWN)


What?!! Wait a minute: bridge0 is in state DOWN ?!? This can't be correct because my wlan0 interface is working!
The bridge logic seems to be wrong: If the first interface is in DOWN state, and the second in UNKNOW state, then bridge is in DOWN state.

Let's check by plugging re1 and testing the "kernel view" again:

(kgdb) p ifindex_table[2].if_link_state
$6 = 2 '\002'
(kgdb) p ifindex_table[6].if_link_state
$7 = 2 '\002'

Confirmed: once re1 switch to "LINK UP" state, the bridge switch to "LINK UP" too!!
There is definitively a bug in the bridge logic here, full detailed explanation here:
https://lists.freebsd.org/pipermail/freebsd-current/2016-January/059274.html

But I was not able, as simple user, to found by myself the exact index table name and variable name to debug :-(

Could I did it with D-trace ?

Checking kernel interface status: modern's way


Dtrace guide (http://dtrace.org/guide/preface.html) mention:
"DTrace is a comprehensive dynamic tracing framework for the illumos™ Operating System. DTrace provides a powerful infrastructure to permit administrators, developers, and service personnel to concisely answer arbitrary questions about the behavior of the operating system and user programs"

=> As a "service personnel" I should be able to use it ;-)

First "freebsd dtrace" google answer is: https://wiki.freebsd.org/DTrace/Tutorial
This tutorial explains how to display all available dtrace probes… but what is a probe?
"A probe is a location or activity to which DTrace can bind a request to perform a set of actions, like recording a stack trace, a timestamp, or the argument to a function. Probes are like programmable sensors scattered all over your illumos system in interesting places." (for official guide).

For my "link state" problem, I will start by searching probes named  "link_state" or "linkstate":

root@fbsd-router# dtrace -l | grep 'link.*state'
   ID   PROVIDER            MODULE                          FUNCTION NAME
16563        fbt            kernel              do_link_state_change entry
16564        fbt            kernel              do_link_state_change return
16740        fbt            kernel                   vlan_link_state entry
43390        fbt            kernel              if_link_state_change entry
43391        fbt            kernel              if_link_state_change return
53619        fbt            kernel      usbd_req_set_port_link_state entry
53620        fbt            kernel      usbd_req_set_port_link_state return
55751        fbt         if_bridge                  bridge_linkstate entry
55825        fbt         bridgestp                    bstp_linkstate entry
55826        fbt         bridgestp                    bstp_linkstate return

There are some interesting results. But before to use them I had to read the dtrace guide:
"dtrace use D programming language for scripting action when probe are triggered."

As example, if I want to display "dtrace probe triggered" each time the dtrace proble "bridge_linkstate" is triggered, I can use this command:
dtrace -f 'bridge_linkstate {trace("dtrace probe triggered")}'

Here is an example:

root@fbsd-router:~ # dtrace -f 'bridge_linkstate {trace("dtrace probe triggered")}'
dtrace: description 'bridge_linkstate ' matched 1 probe
=> now I plug re1 interface to a switch

CPU     ID                    FUNCTION:NAME
  1  55751           bridge_linkstate:entry   dtrace probe triggered
=> now I unplug re1 interface

  1  55751           bridge_linkstate:entry   dtrace probe triggered
=> now I plug-back re1

  1  55751           bridge_linkstate:entry   dtrace probe triggered
=> now I unplug re1 interface

  1  55751           bridge_linkstate:entry   drace probe triggered
(...)

I've remove the other lines, because I've play with this cable during about 1 hour :-)

I can see when this probe was triggered…but I have no idea of the variable values changed (or not) before and after this call, then this information is almost useless.

Here came melifaro@ again that brings me a full dtrace script (I've added the comments):

/* The BEGIN is a special probe triggered at the begining of the script
   The purpose here is to define a table giving link_state value=>description
*/
BEGIN {
        a[0] = "UNKNOWN";
        a[1] = "DOWN";
        a[2] = "UP";
}

/* Defining an action when probe if_bridge:bridge_linkstate:entry is triggered
   Notice that each probe had an :entry and :return
   and entry or return variable are called "arg0"
   If you need the return code of the function, :return is used
*/
fbt:if_bridge:bridge_linkstate:entry
{
/* Need to read sys/net/if_bridge.c for understanding this dtrace function
  bridge_linkstate() is called with an ifnet structure pointer as argument (arg0).
           First step is to cast arg0 into ifnet struct for using it: this->m_ifp
  But we can't directly use this->m_ifp->if_link_state, because as a bridge interface,
  this ifnet struct includes a specific "software state for each bridge"
  (bridge_softc struct) as if_bridge.
  Second step is to cast this->m_ifp->if_bridge into a bridge_softc struct: this->sc
  The first member of a bridge_softc struc is a standard ifnet structure nammed ifp.
           Then, at last, we cast ifnet struct on it: self->ifp
  Now we can get the if_link_state with self->ifp->if_link_state
*/
        this->m_ifp = (struct ifnet *)arg0;
        this->sc = (struct bridge_softc *)this->m_ifp->if_bridge;
        self->ifp = (struct ifnet *)this->sc->sc_ifp;
}

/* Defining an action when probe kernel:do_link_state_change is triggered
   Notice the /self->ifp/
   This is specific to D language that didn't include control flow (like if, while,).
   Then here, each time this probe is triggered, the condition between / is checked.
   If false (=0), code is not exectuted.
   Here the condition is self->ifp, this mean this condition is triggered only if
   this variable was set (non NULL) by the previous probe.
*/

fbt:kernel:do_link_state_change:entry
/self->ifp/
{
        /* originaly a stack trace was displayed but I've commented it
stack();
*/
/* Need to read sys/net/if.c for understanding this dtrace function
   static void do_link_state_change(void *arg, int pending)
           the first argument (arg0) is an ifnet structure, the second argument is the "new" state to apply
*/
        printf("linkstate changed for %s to %s", stringof(self->ifp->if_xname),
                a[self->ifp->if_link_state]);
/* Then reset the triggering variable to NULL */
        self->ifp = NULL;
}

Let's try it:

root@fbsd-router:~ # dtrace -s bridge.d
dtrace: script 'bridge.d' matched 3 probes

=> now I plug re1:

CPU     ID                    FUNCTION:NAME
  0  16563       do_link_state_change:entry linkstate changed for bridge0 to UP
=> now I unplug re1:

  1  16563       do_link_state_change:entry linkstate changed for bridge0 to DOWN
=> now I plug re1 again:

  1  16563       do_link_state_change:entry linkstate changed for bridge0 to UP
^C

Great, this tool give "live" view of my REAL current interface status from the kernel point of view.
For using Dtrace, like with kgbd, I had to read FreeBSD sources (man page is outdated here).
For this small "easy" troubleshooting, kgbd is a lot's more easy and faster choice.
But it's too late: I've started to read FreeBSD source code and learned how to use Dtrace now :-)

Small bugs, beware I'm coming!

mercredi, septembre 16, 2015

Recipe for building a 10Mpps FreeBSD based router

First you need a server, with a minimum of 8 cores and a good NIC.
My setup is this one:

  • HP ProLiant DL360p Gen8: 8 cores Intel Xeon E5-2650 @ 2.60GHz
  • Quad port 10 Gigabit Chelsio TS540-CR


The first step is to entering the UEFI and disabling Hyper-Threading.
(note to myself: Need to generate benchmark comparing HT impact for a router use)

Once done, you can install a FreeBSD on it… but not a classical 10.2!

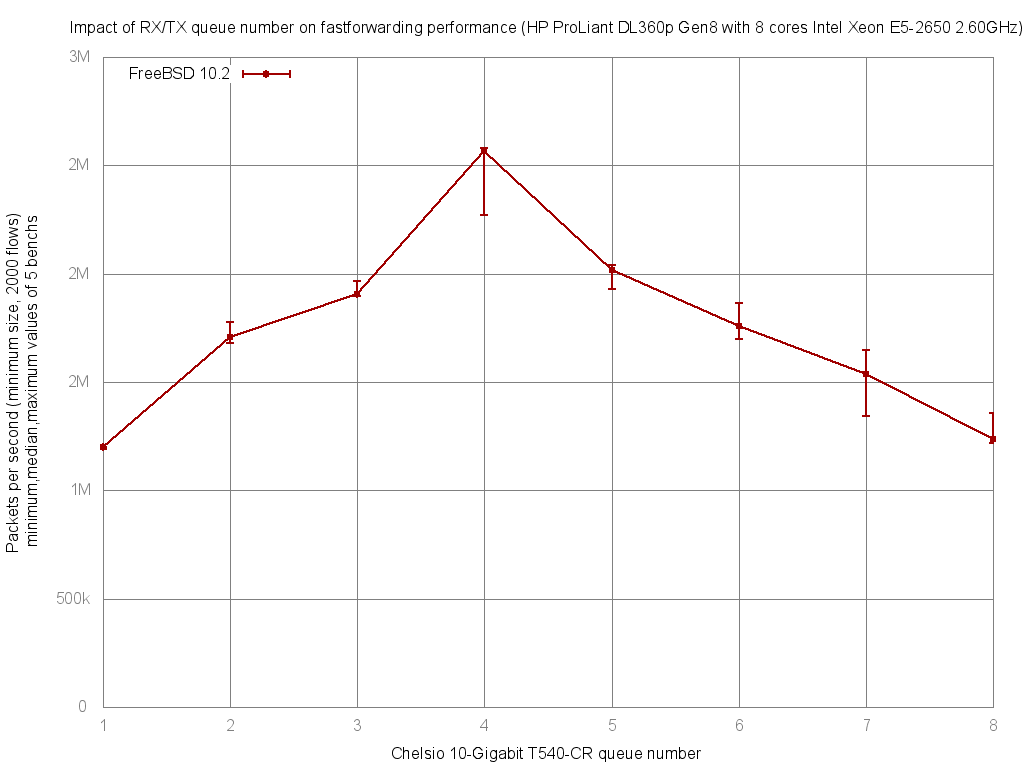
Default behavior of FreeBSD multi-queue NIC drivers is to create a number of queue equal to number of core (with a maximum number of 16 for Chelsio).
This mean for a 8 cores server, it will create 8 queues:
  • Each queue will obtain its own IRQ
  • The NIC will load-balance in/out frames between these queues
The NIC load-balance algorithm kepts same flow on the same queue by default: Then you need lot's of differents flow (different src/dst IP addresss or TCP/UDP ports) for a correct distribution among all theses queues: Don't bench your setup with only one FTP flow as example.

And FreeBSD meet a problem here because the number of queue/core didn't scale well after 4 cores:


=> On this 8 cores setup, you need to reduce your NIC queue number to 4 for the best performance.

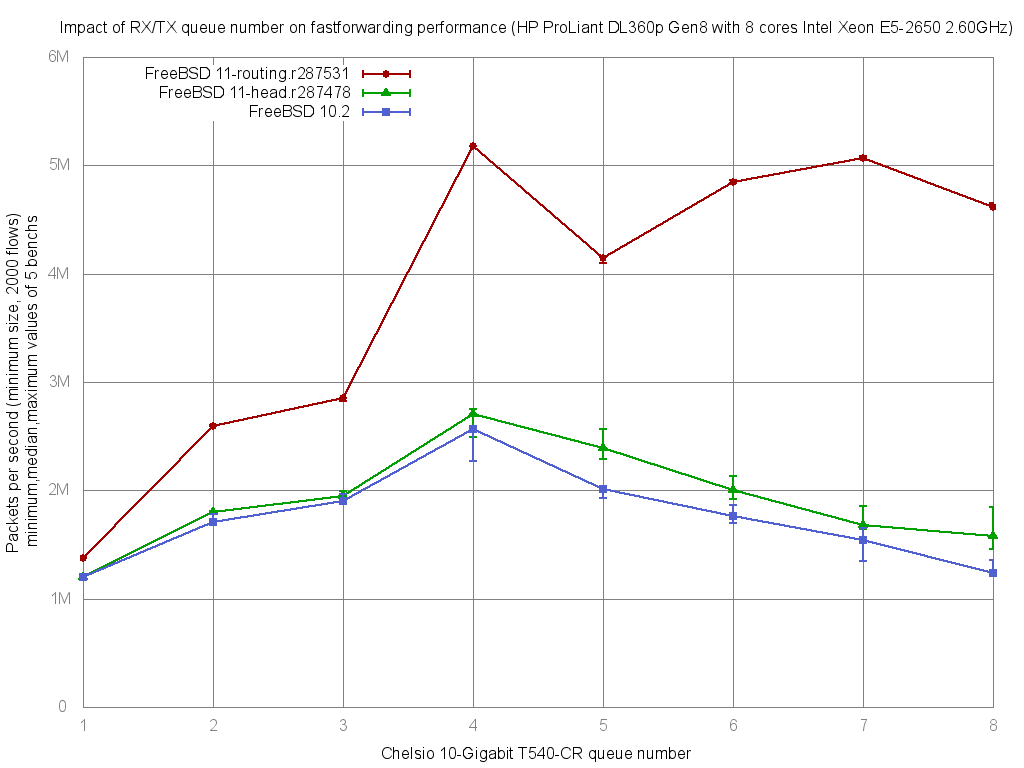
But recently this problem was resolved by Alexander V. Chernikov (melifaro) on its experimental projects/routing branchs (lot's of cleaning regarding fine locking and testing new ideas):


Well… almost resolved: We see a big improvement and perfect linear scale up to 4 cores but still not linear to 8 cores. 
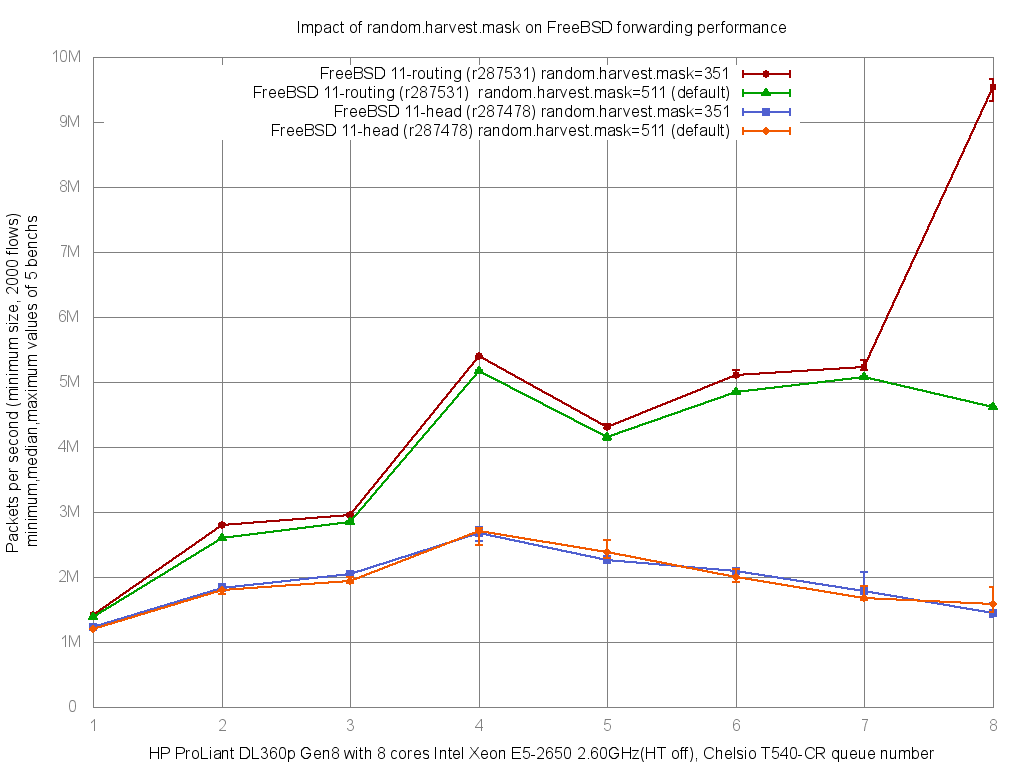
And surprisingly this non-linear problem isn't related to the improvement in forwarding code, but to the new random entropy harvester brings recently in head that is collecting first 2 bytes of each frame under single mutex.
Disabling INTERRUPT and NET_ETHER entropy sources (by adding harvest_mask="351" in /etc/rc.conf) solve the problem:


=> 9.5Mpps on this setup !

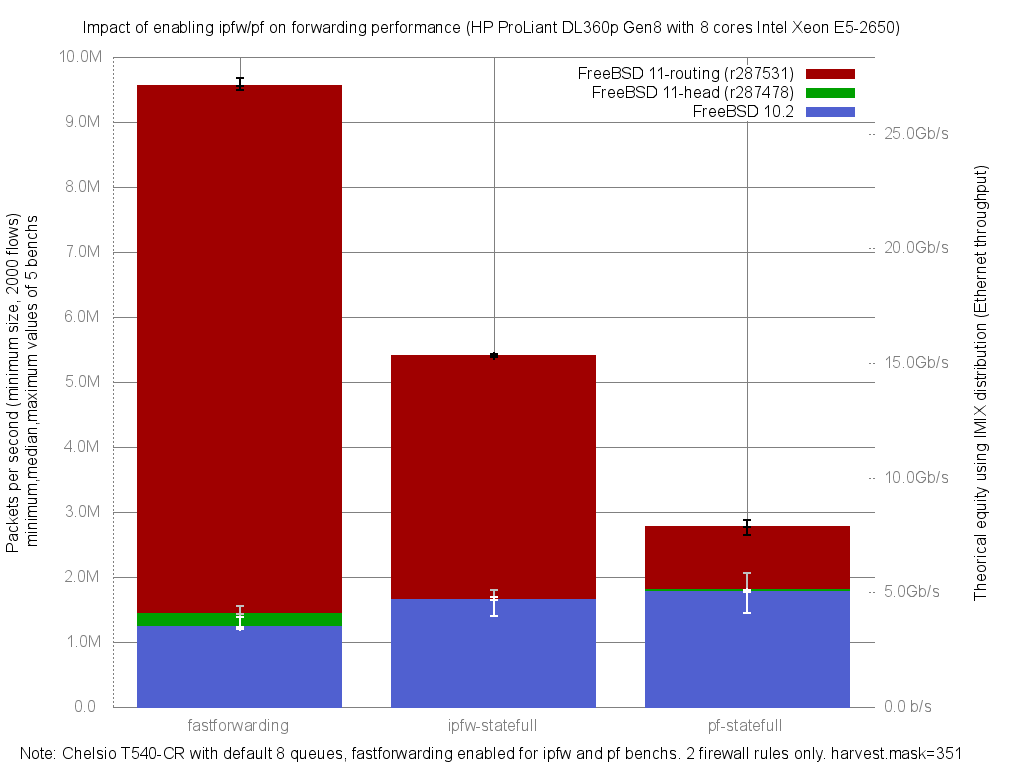
And for non-network people who didn't understand value in "paquet-per-second", here is a different graph regarding impact on forwarding performance with ipfw or pf enabled. With the equivalent IMIX on the right side:


Now how to reach 10Mpps? Just use a little more powerful CPU ;-)

And if you want to test these new performance on your hardware you just need one USB flash disk and installing on it these BSD Router Project (nanobsd) EXPERIMENTAL images used for theses benchs. It's just a dd to the USB flash disk, and more installation instructions are on BSDRP web site.

mercredi, juin 24, 2015

Serial-PXE-TFTP install of FreeBSD(BSDRP,Xsense,NAS4Free)/OpenBSD/Centos

Objectives

Remote  installation of multiples Operating systems using only:
  • FreeBSD server with a PXE and TFTP services
  • Serial console: IPMI Serial-over-LAN (sol)

I didn't found an easy way for PXE+TFTP (only!) serial remote installation for NetBSD or DragonFly.
FreeBSD was very complex too (need to recompile bootloader for TFTP and serial usage), but hopefully mfsBSD hides this problem.
OpenBSD and CentOS, by providing ramdisk natively and easy way of configuring their bootloader, were the most admin-friendly.

dnsmasq

This step will install an all-in-once DHCP/TFTP server:
pkg install dnsmasq
Then, create a small configuration file (example with "bce1" as NIC and local subnet in 192.168.1.0/24)
cat > /usr/local/etc/dnsmasq.conf <<EOF
interface=bce1
dhcp-range=192.168.1.80,192.168.1.85
pxe-service=x86PC, "pxelinux", pxelinux
enable-tftp
tftp-root=/tftpboot
EOF


And start it:
sysrc dnsmasq_enable=yes
service dnsmasq start

pxelinux

This step will install pxelinux binaries and configure PXE menu:
mkdir /tftpboot
cd /tftpboot
fetch https://www.kernel.org/pub/linux/utils/boot/syslinux/syslinux-6.03.zip
unzip -d syslinux syslinux-6.03.zip
cp syslinux/bios/memdisk/memdisk /tftpboot
cp syslinux/bios/core/pxelinux.0 /tftpboot
cp syslinux/bios/com32/elflink/ldlinux/ldlinux.c32 /tftpboot
cp syslinux/bios/com32/menu/menu.c32 /tftpboot
cp syslinux/bios/com32/libutil/libutil.c32 /tftpboot
cp syslinux/bios/com32/modules/pxechn.c32 /tftpboot
cp syslinux/bios/com32/lib/libcom32.c32 /tftpboot

cp syslinux/bios/com32/chain/chain.c32 /tftpboot
cp syslinux/bios/com32/modules/reboot.c32 /tftpboot/
rm syslinux-6.03.zip
rm -rf syslinux
mkdir /tftpboot/pxelinux.cfg
cat > /tftpboot/pxelinux.cfg/default <<EOF

SERIAL 0 115200
CONSOLE 0
UI menu.c32
TIMEOUT 300
MENU TITLE PXE BOOT MENU
LABEL freebsd
 MENU DEFAULT
 MENU LABEL mfsbsd (FreeBSD, pfSense, BSDRP, NAS4Free, etc...)
 KERNEL memdisk
 APPEND initrd=/mfsbsd-10.1-RELEASE-amd64.img harddisk raw
LABEL openbsd
 MENU LABEL OpenBSD
 KERNEL pxechn.c32
 APPEND ::/openbsd/pxeboot
LABEL netbsd
 MENU LABEL NetBSD
 KERNEL pxechn.c32
 APPEND ::/netbsd/pxeboot_ia32_com0.bin
LABEL centos
 MENU LABEL Centos 7
 kernel centos/vmlinuz
 append initrd=centos/initrd.img method=http://mirror.centos.org/centos/7/os/x86_64/ devfs=nomount ip=dhcp console=ttyS0,115200 earlyprint=serial,ttyS0,115200
LABEL local
 MENU LABEL local disk
 KERNEL chain.c32
 APPEND hd0

LABEL reboot
 MENU LABEL reboot
 KERNEL reboot.c32
EOF

FreeBSD

Download mfsBSD image and enable serial port:
fetch -o /tftpboot/mfsbsd-10.1-RELEASE-amd64.img http://mfsbsd.vx.sk/files/images/10/amd64/mfsbsd-10.1-RELEASE-amd64.img
mdconfig -a -t vnode -f mfsbsd-10.1-RELEASE-amd64.img
mount /dev/md0a /mnt/
echo "-S115200 -h" > /mnt/boot.config

umount /mnt
mdconfig -d -u 0

OpenBSD

Download OpenBSD's pxeboot and RamDisk image, then enable serial port:
mkdir /tftpboot/openbsd/
fetch -o /tftpboot/openbsd/pxeboot http://ftp.openbsd.org/pub/OpenBSD/5.7/amd64/pxeboot
fetch -o /tftpboot/openbsd/bsd.rd http://ftp.openbsd.org/pub/OpenBSD/5.7/amd64/bsd.rd
mkdir /tftpboot/etc
cat > /tftpboot/etc/boot.conf <<EOF
stty com0 115200
set tty com0
boot tftp:/openbsd/bsd.rd
EOF

CentOS

Download CentOS kernel and RamDisk:
mkdir /tftpboot/centos
fetch -o /tftpboot/centos/initrd.img ftp://ftp.free.fr/mirrors/ftp.centos.org/7.1.1503/os/x86_64/images/pxeboot/initrd.img
fetch -o /tftpboot/centos/vmlinuz ftp://ftp.free.fr/mirrors/ftp.centos.org/7.1.1503/os/x86_64/images/pxeboot/vmlinuz

Installing BSDRP, pfSense, OPNsense, NAS4Free, or any nanoBSD

From mfsbsd, just dd their serial nanobsd/embedded image to the local hard drive.
For installing FreeBSD: just uses bsdinstall

Debugging PXE/TFTP process

From the server, start a tcpdump accepting only bootps and tftp packets:
tcpdump -ni bce1 -vv port bootps or port tftp

lundi, octobre 13, 2014

ipfw improvement on FreeBSD -current

Few days ago Alexander V. Chernikov posted on the FreeBSD -net mailing list an "HEADS UP: Merging projects/ipfw to HEAD" with lot's of promises:
  • Tables are now identified by names, not numbers. There can be up to 65k tables with up to 63-byte long names.
  • Tables are now set-aware (default off), so you can switch/move them atomically with rules.
  • More functionality is supported (swap, lock, limits, user-level lookup, batched add/del) by generic table code.
  • New table types are added (flow) so you can match multiple packet fields at once.
  • Ability to add different type of lookup algorithms for particular table type has been added.
  • New table algorithms are added (cidr:hash, iface:array, number:array and flow:hash) to make certain types of lookup more effective.
  • Table value are now capable of holding multiple data fields for different tablearg users
I'm not an expert of ipfw(8), but I would check the impact of this improved-ipfw on forwarding performance. By "performance" I mean how this code impact the throughput (in term of packet-per-second) of my FreeBSD firewall (I didn't bench all the parameters requiered by RFC3511).
Once the code was committed as r272840 on -head, I've generated a new nanobsd(8) image on my 10gigabit bench lab… and here are the results:


More than 100K pps of differences! Now I dream of an ipfw_sync equivalent to pf_sync(4).
And here are the ministat output for statistician extremists.
Regarding ipfw in stateless mode:


x 272685.ipfw-stateless
+ 273009.ipfw-stateless
+----------------------------------------------------------------------+
|x      x     x    x                                  + + +      +    +|
|   |______A__M___|                                                    |
|                                                     |___M__A_____|   |
+----------------------------------------------------------------------+
    N           Min           Max        Median           Avg        Stddev
x   5       1585928       1619817       1608891     1604564.2     12728.878
+   5       1683246       1712607       1690405     1695508.6      12250.89
Difference at 95.0% confidence
        90944.4 +/- 18219.1
        5.66786% +/- 1.13546%
        (Student's t, pooled s = 12492.2)

And regarding ipfw in statefull mode:


x 272685.ipfw-statefull
+ 273009.ipfw-statefull
+----------------------------------------------------------------------+
|xx    x   x    x                       ++   +    +                   +|
||_____A______|                                                        |
|                                    |_______M___A____________|        |
+----------------------------------------------------------------------+
    N           Min           Max        Median           Avg        Stddev
x   5       1390415       1433678       1407058     1408663.4     18451.472
+   5       1502719       1589778       1517320     1529871.8     35404.181
Difference at 95.0% confidence
        121208 +/- 41172.4
        8.6045% +/- 2.9228%
        (Student's t, pooled s = 28230.4)